
Profit margins of horror movies
Among movie genres, horror stands out for the relatively high number of low budget films that have become blockbusters. These low budget movies are often categorized as B Movies, which Wikipedia defines as low budget, non-arthouse films. For this analysis, I wanted to see what factors - in particular budget - impact the profit margin of horror movies.
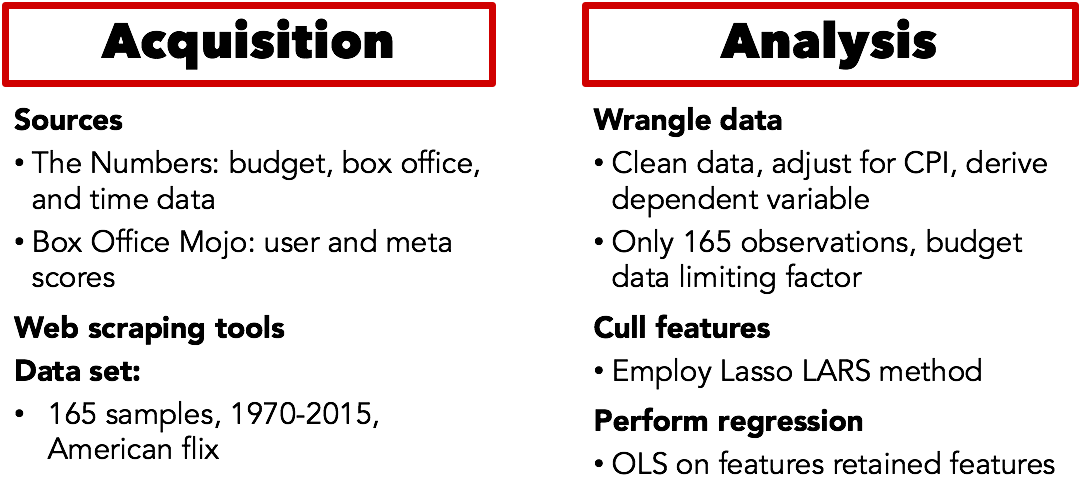
Methodology
I broke up this analysis into data acquisition and analysis phases. I scraped data from The Numbers and Box Office Mojo using Selenium and Beautiful Soup, respectively. From these websites, I obtained my feature data: budget, domestic and international box office revenues, release date, and meta critic and user scores. I also deduced whether the movies were sequels or not.
I performed a Lasso LARS analysis on the features to see which ones were of significance and which could be dropped. The Lasso LARS analysis showed that only budget, release year, and meta critic scores should be retained. This initially surprised me because I thought that meta user scores in particular would be a key feature. Looking back it makes sense that user scores - which correlate with critic scores - would be removed. This is because Lasso - when given two features that are highly correlated - will only select one and drop the other. I’m still not sure why sequels / remakes were not features of significance, and would need to look into this further if I do another analysis on this topic.
Analysis
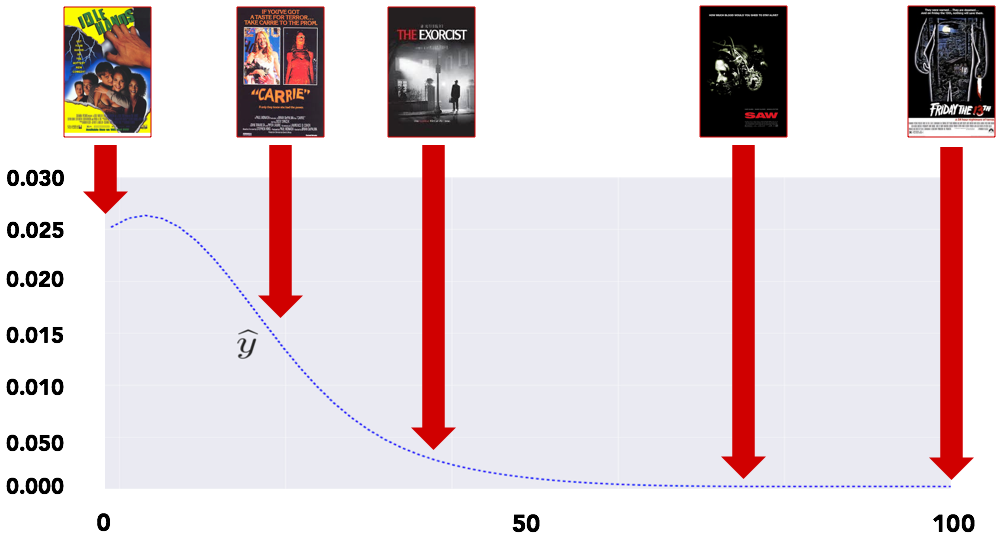
The histogram of profit margins includes overlays of movies. Duds like Idle Hands (which I thoroughly enjoyed by the way) had zero or negative margins, while blockbusters like Carrie and the Exorcist were at 13 and 33, respectively. The first Friday the 13th had a margin of 100, meaning that its profit was 100 times more than its production buffet! I guess that’s why they made a gazillion sequels.
I generated a histogram of profit margins for the 165 horror movies for which I had complete data. Predictably, the data followed an exponential distribution, meaning most movies had lower profit margins - with an average of 20 - with a few movies having outstanding profit margins.
It’s worth pointing out that the budget data I obtained from The Numbers likely doesn’t include marketing and other costs, meaning the profit margin numbers reported in this analysis may be significantly over-estimated.
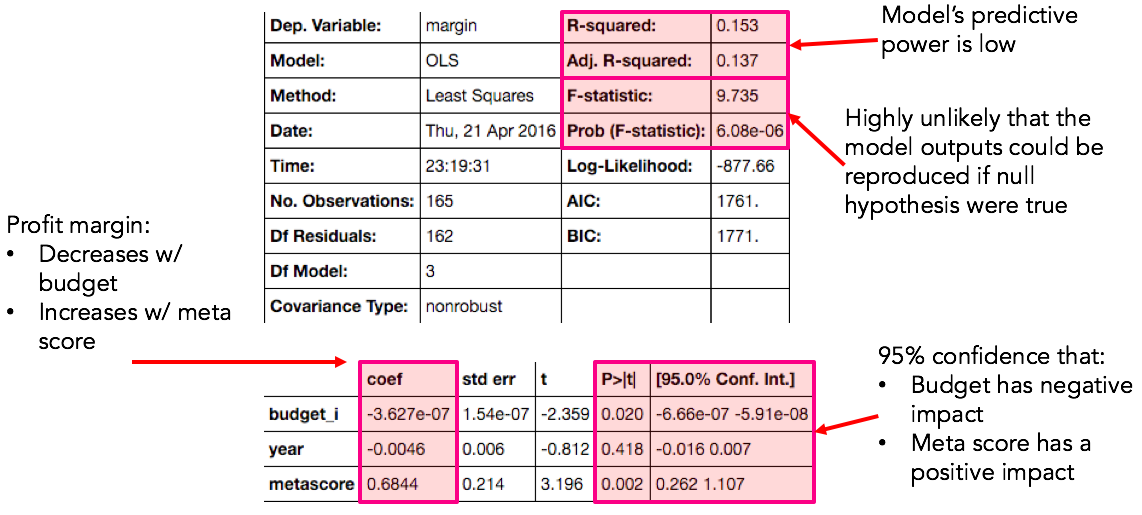
The regression stats below show that the model’s predictive power is low, with an r-squared of just 0.153. Even so, the probability that the model outputs could be reproduced if the null hypothesis were true is quite low. Among the features, there is 95% confidence that budget and meta score have negative and postive impacts, respectively, on profit margin.
Conclusions and Next Steps
Further analysis is needed before we can conclude more about B movies in particular. Even so, below are features of statistical significance:
- There is a slightly negative correlation between budget and profit margin among all surveyed horror movies, owing perhaps to the wild success of B horror movies
- There is a positive correlation between meta score and profit margin, which makes sense intuitively
Things I didn’t expect / was surprised by:
- Lasso LARS method did not find significant correlation between users’ scores and profit margin
- The lack of budget data on The Numbers site really limited my sample size
Going forward:
- Bigger sample size would make analysis more robust
- Normalize variables like year
- This would give us a more complete picture of the profit margins of horror movies in general and B horror movies in particular
- Include other features such as ratings, directors, actors, etc.
Check out my code on Github!