
Revealing economic growth using night lights
After having worked in several developing countries, I’ve noticed that socio-economic data that is readily available in countries like the US - data we take for granted - is often unavailable in emerging markets. The means of collecting basic socio-economic data often simply aren’t there. So then, how do we measure economic growth in places where statistics are imprecise or unavailable?
An Alternative to Traditional Statistical Methods
Let’s look at an example of this issue. Annual GDP data for Syria and Afghanistan, two countries that have endured civil war, are unavailable for certain years, as shown in the figure below.
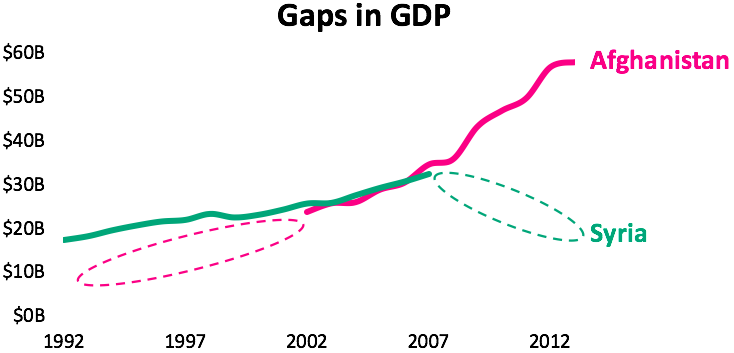
To fill data gaps such as these, economists and other researchers have used satellite night imagery as a proxy for economic activity. The image of satellite night lights from 2013 shown below suggests that there may be correlations between economic activity and night lights. My curiousity picqued, I wanted to see if I could fill in GDP data gaps like those in Syria and Afghanistan using satellite night light imagery.
Methodology
I obtained NOAA satellite night imagery data from 1992 to 2013 and GDP data from World Bank. Using these inputs, I performed nearly 200 country-level regressions and estimated the GDPs of over 400 cities. To keep things simple, I stuck with linear regression.
Results
The choropleth map below shows how well night lights pixel values correlated with annual GDP for a given country. Deeper blue indicates a better correlation. We see that, in general, night lights for emerging markets tend to correlate better to GDP than they do for developed countries. I think this may be because developed countries 1) are already electrified, 2) have light pollution ordinances, and 3) have more advanced energy efficiency initiatives.
Let’s dive deeper into the data and take a look at Syria. Shown below is an animation of Syria’s night lights from 1992 to 2013. World Bank GDP data for Syria is unavailable from 2008 onwards. We can see that the light intensity tends to increase up until 2011, when the civil war in Syria began. After that, the lights dim, and we can surmise that GDP correspondingly decreased from then on.
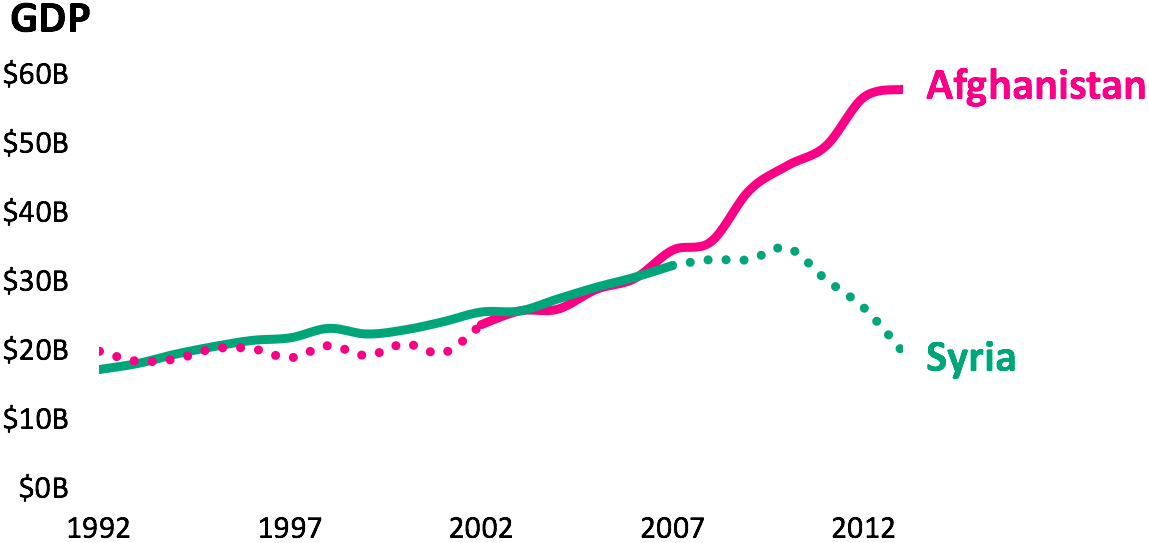
Now let’s use the results from the regression to fill in the GDP gaps for Syria and Afghanistan. Not bad!
Where do we go from here?
First, we can estimate GDP at the subnational level. I’ve already done this, and the preliminary results look good. Second, we can improve the regression model by 1) using a non-linear equation and 2) introducing other spatial and non-spatial datasets. Third, we can use light data to estimate other variables of interest, such as population and per capita income.
Check out the code on Github if you want to reproduce these results.