
Loan activity among microlenders
There are an estimated 2 billion unbanked adults who lack access to traditional financial services, including credit. Microloans are small loans that provide credit to these lower-income, typically unbanked borrowers. Using platforms like Kiva, individuals can become microlenders and connect to borrowers in other parts of the world. Since Kiva was founded in 2005, 1.4 million lenders have issued $840 million in loans across 84 different countries. Other companies and non-profits have taken notice, and are moving into the microlending space.
One of these organizations – Seeds – asked me to investigate the following question: who are microlenders?
Methodology
Kiva helpfully provides lender, loan, and borrower data through its API. From the API, I downloaded a data snapshot of json files, and sampled this data to see if demographic data provided in the sample data was related to the average number of loans that Kiva users make per year. Below is a depiction of the methodology and workflow that I employed to complete this analysis.
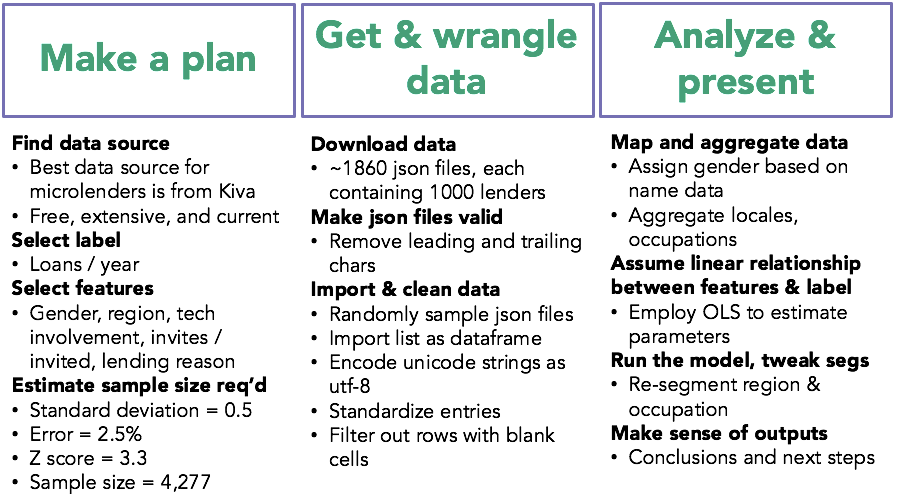
I downloaded 1,860 json files, each containing 1,000 lender records. each record included name, occupation, location, reason for lending, number of loans, and Kiva join date. After training my model on various trial feature sets, I decided to include the following in my final feature set: gender, region, tech involvement, reason for lending, and invites sent to other users. I deduced gender from name data and aggregated location into two categories: 1) United States & Canada and 2) the rest of the world. I derived tech involvement from occupation, and took the string length of lending reason as a gauge to test a given lender’s enthusiasm.
Analysis
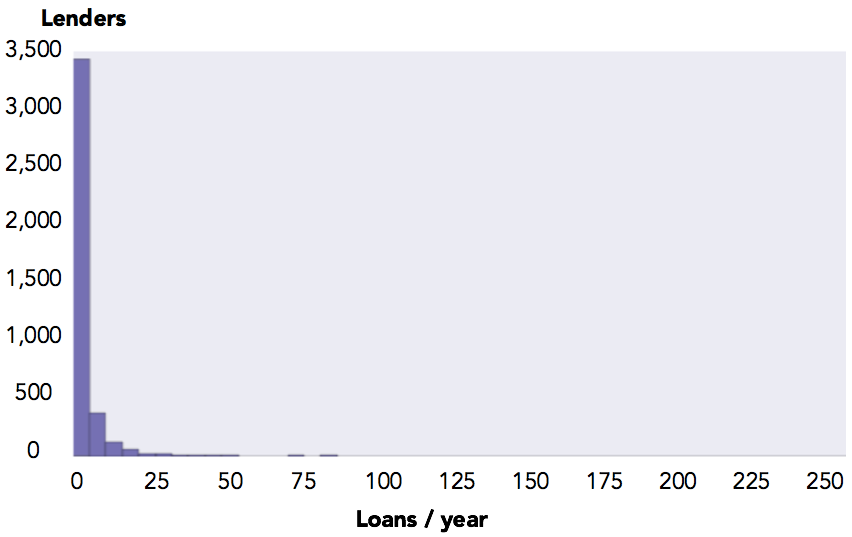
A histogram of loans per year indicates that loans per year may be distributed exponentially, with most lenders making just a few loans in a typical year. Within the sample, the mean loans per year was about 4 per year with a standard deviation of 12.
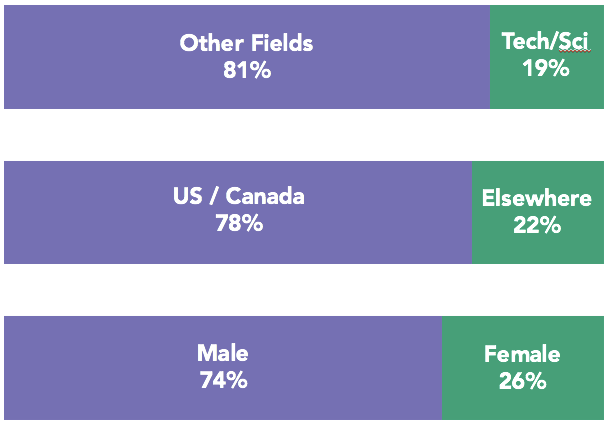
The chart below shows that Kiva users tend to be based in the US and male. Additionaly, almost 20% of the sample is involved in the tech industry or sciences.
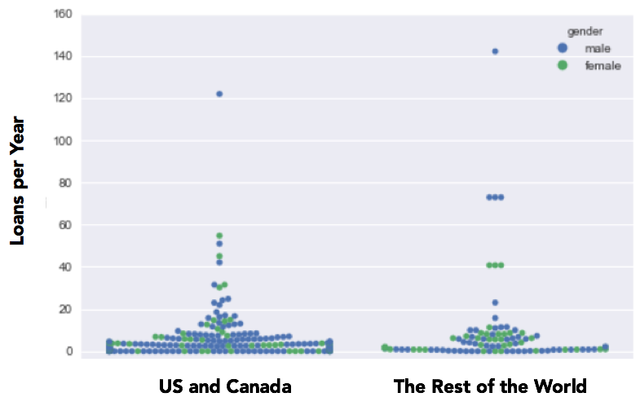
I wanted to get an idea of the sample distribution by category, and so I created the chart below using Seaborn. We can see that the distribution of people from the US and Canada seems to be more concentrated at the lower end of loans per year axis than those in the rest of the world. In addition, high loans per year outliers are primarily male.
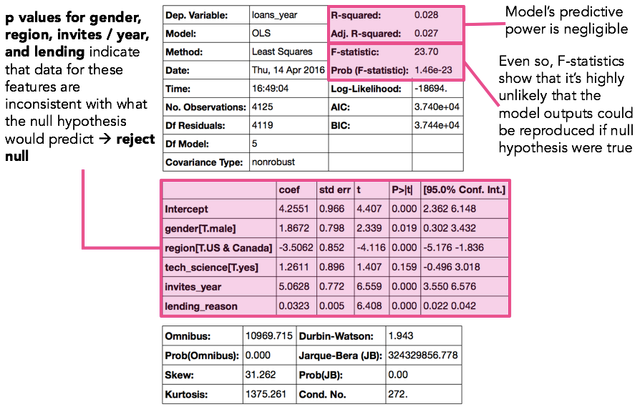
The statistical results are shown below. The R-squared value is low, and so the model’s predictive power is nil. However, p values for the gender, region, invites per year, and lending reason features are low enough that we can reject the null hypothesis that these features have no impact on lending activity.
Conclusions and Next Steps
This is a preliminary analysis, and more insights could be gleaned from the Kiva data. Even so, we can draw the following conclusions from this analysis:
- Microlending activity across microlenders seems to be exponentially distributed;
- While the model developed for this analysis is not predictive, it does explain a subset of the types of people that tends to make more microloans;
- Within the sample data, males and people living outside the US and Canada tend to be more active microlenders; and,
- More analysis is needed before we can say the same for people involved in tech and the sciences.
Further analysis may show that the selected features for this model should be refined, removed, or added. With a more predictive model, I could move on to test the training data with test data to see if model is over or under fitted. Check out my code on Github.